
Statistics, log files and usage
How much disk space and bandwidth you use, how many visitors your site gets and where to find error messages.
Your package's usage
The dashboard shows your disk space, bandwidth, email addresses and databases at a glance. More detail is under System Info & Files → User statistics:
- Usage statistics: usage per item, such as email, databases and number of files (Inodes). Update recalculates the disk space.
- Account info: your package's details and limits.
- History: usage per month.
- Disk usage: which folders take up the most space.
- Bandwidth breakdown: bandwidth per domain and per item.
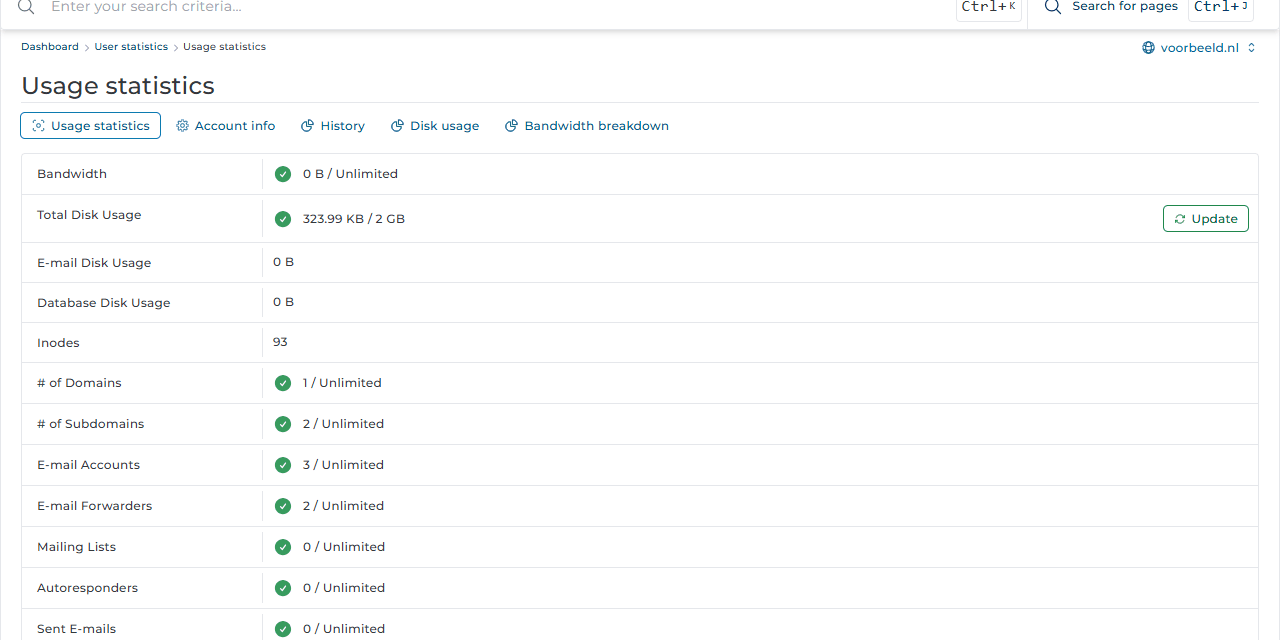
You can also see usage in the customer panel for your web hosting package.
Disk space almost full? Check Disk usage first. Often it is old backups in the
backupsfolder, or mailboxes holding years of email.
Visitors and log files
Go to System Info & Files → Site summary & logs. For each domain and subdomain you get:
- View stats: visitor statistics (Webalizer), with visitors, pages and referrers per month. They are updated every night.
- Usage log: the raw list of recent visits.
- Error log: error messages from the web server and PHP. Look here when your site shows a blank page or a 500 error.
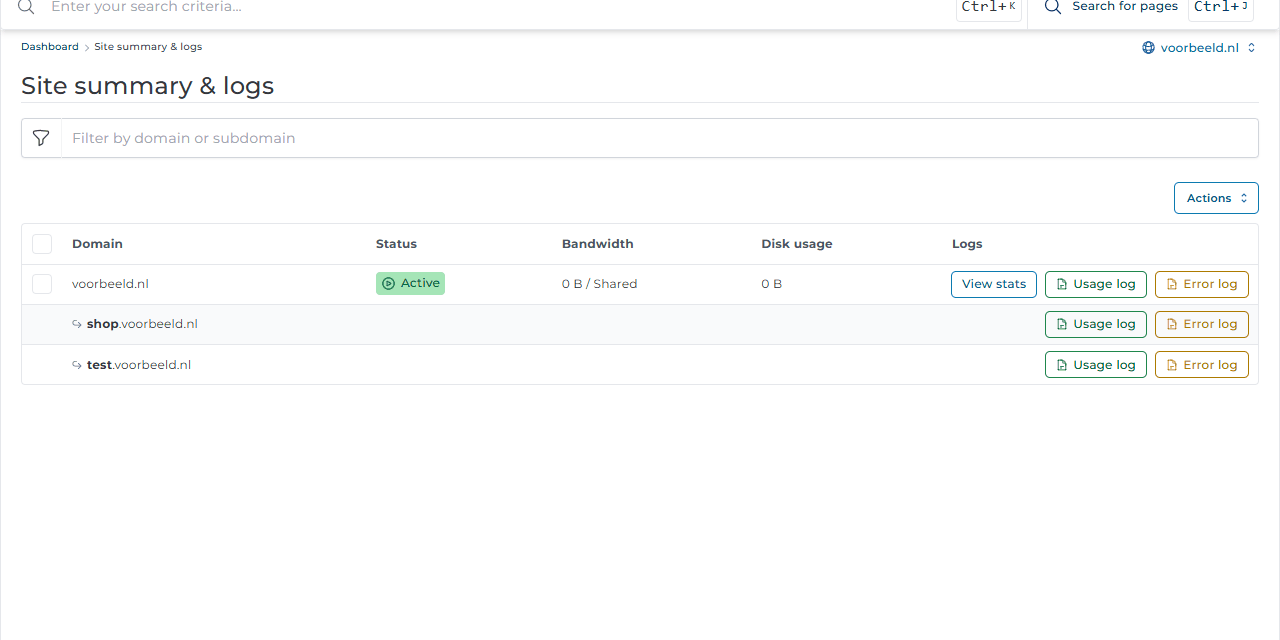
The customer panel also shows the number of visitors per month for your package.
Server load
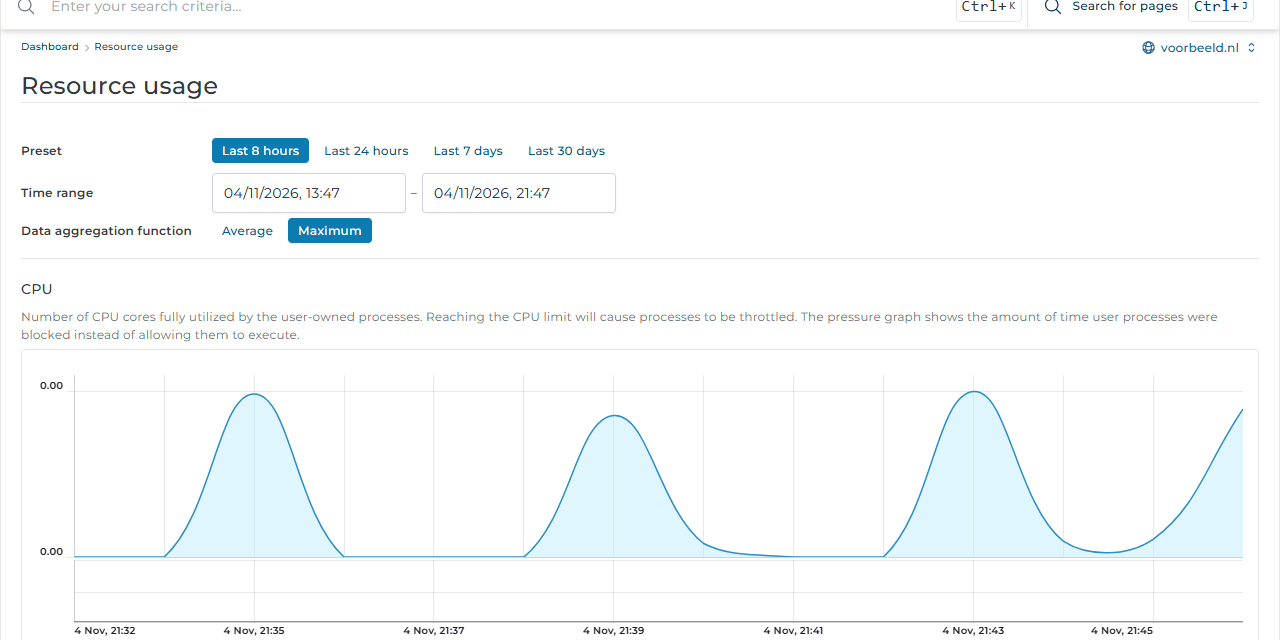
System Info & Files → Resource usage shows how much processing power (CPU), memory and disk activity your website uses, over the last 8 hours, 24 hours, 7 or 30 days. A peak can mean many visitors, a heavy cron job or an attack. Is your site slow and do you see high values here? Create a ticket and we will take a look.
Server information
System Info & Files → System Information shows which server your package is on and what software it runs. Useful when a developer asks.